Yes, the final one!!! I am working on some awesome volcano posts, you are going to hear all about my favorite volcanoes, thoughts on eruptions that could affect us and even the bizarre complaint from evacuees from Merapi last year (Bizarre doesn't really cover it - more on that later).
Anyways, here goes, the key things to remember to tomorrow:
1) This is a Skills exam - use your skills (data analysis) just like in the Lower Sixth, you need to refer to data, not necessarily just the one they refer you to but perhaps to others as well if its relevant to the question
2) Remember the timings - 1.5 minutes per mark, don't go too far over as there will be long answer questions and you need to budget your time
3) Read the whole paper before you start, and don't worry about the stats test if its there, remember the key meanings and work through it
4) Remember to take everything with you and to the right room - H104/5 and 203/4 or E5, you need black pens, you each need a calculator
5) If you are given new data, remember to use it!
6) by 3 tomorrow afternoon its all over until the summer session, time to go back to tectonics!
See you all tomorrow, there will be a workshop in B21 from 1020 onwards, it is an Upper Sixth Lesson, but open to all classes.
Millie
Showing posts with label Belfast. Show all posts
Showing posts with label Belfast. Show all posts
Monday, 31 January 2011
Friday, 28 January 2011
3 days to go on Belfast
Dear Upper Sixth,
I know many of you are counting down to Tuesday, so this post is another quick reminder of what to do this weekend, and the key meanings and formats for hypotheses for the stats tests we have been working through this week.
Believe me when I say the blog will become super interesting and more relevant to geography as a whole after the Tuesday exam, I have lots of ideas to share for the tectonics module and the final one on climate, but until Tuesday it's Belfast all the way!
So, starting with arguably the hardest thing to maintain interest in, but possibly the easiest way to get good marks, your stats tests. You need to be able to work, use and interpret four key tests, and the basics such as IQR, mean, median and mode.
1) Spearmans Rank - used to test the relationship between two variables and gives three possibly results.
A) a positive correlation - as one goes up, the other goes up (Close to +1)
B) a negative correlation - as one goes up the other goes down (Close to -1)
C) no correlation (close to 0)

Key checks
The answer should not be outside the range 1 to -1
The most common error is the last stage of the equation which is subtracting the result of the division from 1
You need to comment on the relationships strength (closeness to 1 or -1) and its significance, which will be given to you in the table along with the formula
Hypothesis - There will be a significant positive correlation between the number of X religion and the income deprivation of areas in Belfast
2) Standard Deviation - tests the spread of results from a set of data around the mean
A) a high number in comparison to your range of data indicates there is no clustering of results around the mean, and the data is widely dispersed
B) A low number in comparison to your data range indicates most numbers are close to the mean, or are clustered

Key Checks
Make sure you remember to square root the final answer
Hypothesis
Most people in Ward X will fall within the age range of 18 to 25
3) Chi Squared
Tests to see if the observed data from counts in an area is different to that expected. For instance, the number of people employed in different sectors of industry in four different wards. If the result is positive, it means there is a statistically significant difference between observed and expected, you then need to refer back to the raw observed data to analyse the table and find the reason
 Key Checks
Your grand total should be the sum of all your rows or your columns which should be the same number, don't add the two together
Go to 2 decimal places, rounding up from the 3rd for all your calculations
When calculating the degrees of freedom in order to read off significance, be aware it is calculated by
(rows -1) x (columns -1)
Hypothesis
There will be no difference between observed and expected frequencies of users of community centres in the four regions assessed
4) Mann Whitney U
This test is normally done for frequencies or values across two data samples, often surveys or results for two different years. It shows whether or not there is a statistically significant difference, you have to work out if it has increased or decreased from one to the other
Key Checks
You add up your MWU values for each row and take the lower one as your answer
This is the only test for which your value has to be lower than the significance level
You can have different amounts of data in each data set
Significance is read off on a table to give you an accurate number for N in both rows
Hypothesis
Due to regeneration work in Belfast, there will be a significant decrease in hate crimes in regions that have been targeted by the Neighbourhood Renewal Strategy
Hopefully this helps a little,
Keep reading the AIB, come up with your suggestions for the city, be aware of Liverpool and the Docklands for comparative case studies, remember your geography words - Geographerise each sentence and be synoptic!
One final weekend to work then it is all over and we will be back to Tectonics!
I know many of you are counting down to Tuesday, so this post is another quick reminder of what to do this weekend, and the key meanings and formats for hypotheses for the stats tests we have been working through this week.
Believe me when I say the blog will become super interesting and more relevant to geography as a whole after the Tuesday exam, I have lots of ideas to share for the tectonics module and the final one on climate, but until Tuesday it's Belfast all the way!
So, starting with arguably the hardest thing to maintain interest in, but possibly the easiest way to get good marks, your stats tests. You need to be able to work, use and interpret four key tests, and the basics such as IQR, mean, median and mode.
1) Spearmans Rank - used to test the relationship between two variables and gives three possibly results.
A) a positive correlation - as one goes up, the other goes up (Close to +1)
B) a negative correlation - as one goes up the other goes down (Close to -1)
C) no correlation (close to 0)
Key checks
The answer should not be outside the range 1 to -1
The most common error is the last stage of the equation which is subtracting the result of the division from 1
You need to comment on the relationships strength (closeness to 1 or -1) and its significance, which will be given to you in the table along with the formula
Hypothesis - There will be a significant positive correlation between the number of X religion and the income deprivation of areas in Belfast
2) Standard Deviation - tests the spread of results from a set of data around the mean
A) a high number in comparison to your range of data indicates there is no clustering of results around the mean, and the data is widely dispersed
B) A low number in comparison to your data range indicates most numbers are close to the mean, or are clustered

Key Checks
Make sure you remember to square root the final answer
Hypothesis
Most people in Ward X will fall within the age range of 18 to 25
3) Chi Squared
Tests to see if the observed data from counts in an area is different to that expected. For instance, the number of people employed in different sectors of industry in four different wards. If the result is positive, it means there is a statistically significant difference between observed and expected, you then need to refer back to the raw observed data to analyse the table and find the reason

Your grand total should be the sum of all your rows or your columns which should be the same number, don't add the two together
Go to 2 decimal places, rounding up from the 3rd for all your calculations
When calculating the degrees of freedom in order to read off significance, be aware it is calculated by
(rows -1) x (columns -1)
Hypothesis
There will be no difference between observed and expected frequencies of users of community centres in the four regions assessed
4) Mann Whitney U
This test is normally done for frequencies or values across two data samples, often surveys or results for two different years. It shows whether or not there is a statistically significant difference, you have to work out if it has increased or decreased from one to the other
Key Checks
You add up your MWU values for each row and take the lower one as your answer
This is the only test for which your value has to be lower than the significance level
You can have different amounts of data in each data set
Significance is read off on a table to give you an accurate number for N in both rows
Hypothesis
Due to regeneration work in Belfast, there will be a significant decrease in hate crimes in regions that have been targeted by the Neighbourhood Renewal Strategy
Hopefully this helps a little,
Keep reading the AIB, come up with your suggestions for the city, be aware of Liverpool and the Docklands for comparative case studies, remember your geography words - Geographerise each sentence and be synoptic!
One final weekend to work then it is all over and we will be back to Tectonics!
Monday, 24 January 2011
One Week to Go!
Dear Upper Sixth
You are no doubt as relieved as the staff that there is now only one week to go before the Belfast exam, one week is not long, and today's post is a reminder that that this week really needs a final push, you need to keep your interest up and stay on top of the key tips for doing well, so as a written reminder, here is a summary of what you need to be doing:
1) Keep reading the AIB - I know it has been three months, some of you have almost learnt it by heart, but you need to get to the point at which you know it well enough not to have to search for information during the exam to refer to it too much
2) Get on top on the stats tests - you have all done the basics, there are more worked examples coming your way soon, using actual data rather than some made up numbers, you must make sure you question me endlessly until you understand these!
3) Prepare for the questions we know might be coming - the fieldwork (EQA), the most effective part of the regeneration scheme to date, what will have the most significant lasting impact, what are the suggestions for the future (Thank you to the student blog for some "outside the box" thinking on this one!)
4) What are your thoughts - prepare some, they could be almost anything - we have discussed lessening the divide through art, sports, possibly music, media (remember the film) come up with something original and practical that takes into account the history/culture of the region.
5) Remember your words - Geographerise - there are some terms we have used in the sessions on the AIB and the mock that need to form part of your language if you are looking for a top grade - see the brief glossary below - it is by no means exhaustive.
6) Remember that although this is one of the last exams, and I know you are all probably reaching the limit of your motivation to revise and your ability to keep researching, but this is the exam you don't want to retake (it will be an entirely new topic) and with suitable preparation you can do very well in this paper.
Soon we will be back to tectonics, and kicking back of with some comparative volcanic case studies from the last year, Iceland and Merapi, and for earthquakes Haiti and Chile.

So, Statistics....
The ones you need to be able to do
1) Spearmans Rank
2) Mann Whitney U
3) Chi Squared
4) Standard Deviation
5) Inter Quartile Range
6) Averages (Mean, Median and Mode)
You can look at the data and work out what kind of test the data you have lends itself to. You have the websites to get more data, if you have a hypothesis, test it, we will be working on a few in class.
Lastly - the words you need to work into your vocabulary for the next week:
Index of Multiple Deprivation
Sectarian
Inter-Generational Deprivation
Enclave
Peace Walls
Murals
Urban Regeration
De-Industrialization
The Multiplier Effect
The De-Multiplier Effect

My final word for tonight, is an article I stumbled across on segregated cities, truly excellent and a really good read for a summary on the issues in Belfast. I will attempt to condense it tomorrow, but in the meantime do some research!
Hope this helps, and get your stats heads on for the next few days!
Millie
You are no doubt as relieved as the staff that there is now only one week to go before the Belfast exam, one week is not long, and today's post is a reminder that that this week really needs a final push, you need to keep your interest up and stay on top of the key tips for doing well, so as a written reminder, here is a summary of what you need to be doing:
1) Keep reading the AIB - I know it has been three months, some of you have almost learnt it by heart, but you need to get to the point at which you know it well enough not to have to search for information during the exam to refer to it too much
2) Get on top on the stats tests - you have all done the basics, there are more worked examples coming your way soon, using actual data rather than some made up numbers, you must make sure you question me endlessly until you understand these!
3) Prepare for the questions we know might be coming - the fieldwork (EQA), the most effective part of the regeneration scheme to date, what will have the most significant lasting impact, what are the suggestions for the future (Thank you to the student blog for some "outside the box" thinking on this one!)
4) What are your thoughts - prepare some, they could be almost anything - we have discussed lessening the divide through art, sports, possibly music, media (remember the film) come up with something original and practical that takes into account the history/culture of the region.
5) Remember your words - Geographerise - there are some terms we have used in the sessions on the AIB and the mock that need to form part of your language if you are looking for a top grade - see the brief glossary below - it is by no means exhaustive.
6) Remember that although this is one of the last exams, and I know you are all probably reaching the limit of your motivation to revise and your ability to keep researching, but this is the exam you don't want to retake (it will be an entirely new topic) and with suitable preparation you can do very well in this paper.
Soon we will be back to tectonics, and kicking back of with some comparative volcanic case studies from the last year, Iceland and Merapi, and for earthquakes Haiti and Chile.

So, Statistics....
The ones you need to be able to do
1) Spearmans Rank
2) Mann Whitney U
3) Chi Squared
4) Standard Deviation
5) Inter Quartile Range
6) Averages (Mean, Median and Mode)
You can look at the data and work out what kind of test the data you have lends itself to. You have the websites to get more data, if you have a hypothesis, test it, we will be working on a few in class.
Lastly - the words you need to work into your vocabulary for the next week:
Index of Multiple Deprivation
Sectarian
Inter-Generational Deprivation
Enclave
Peace Walls
Murals
Urban Regeration
De-Industrialization
The Multiplier Effect
The De-Multiplier Effect
My final word for tonight, is an article I stumbled across on segregated cities, truly excellent and a really good read for a summary on the issues in Belfast. I will attempt to condense it tomorrow, but in the meantime do some research!
Hope this helps, and get your stats heads on for the next few days!
Millie
Friday, 21 January 2011
Re-Imaging Communities Programme in Belfast
This afternoon while the AS groups were in their exam, I did some research into initiatives having some success in Belfast with reducing the amount of division in the most deprived communities. I came across a scheme I feel are well worth discussing with reference to 4B - the Re-Imaging Communities Programme, set up by the Arts Council.

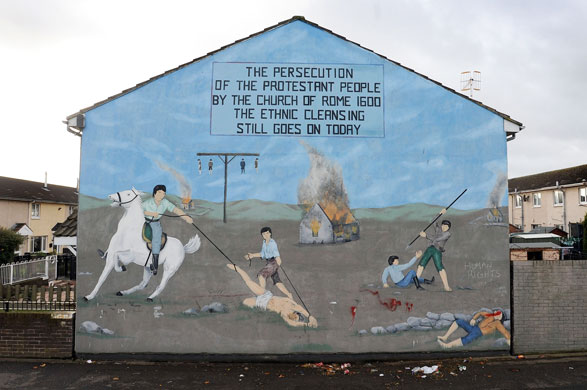
This programme started in 2006 and was created with a view to address the problems faced by Belfast in terms of the sectarian symbolism, from both sides that is clearly evident across Belfast today. Indeed we have discussed on many occasions in class that having such a vivid and public display or loyalty to one cause or another, or a mural designed to commemorate specific events from the Troubles, could lead to further feelings of segregation and separation within neighbourhoods. However, the murals are an important part of Belfast's past, and many do not want them simply white washed and removed from the streets. Furthermore, as the Student blog so accurately points out, progress cannot be made by simply eradicating culture and tradition, or the history of an area, no matter what that history is.
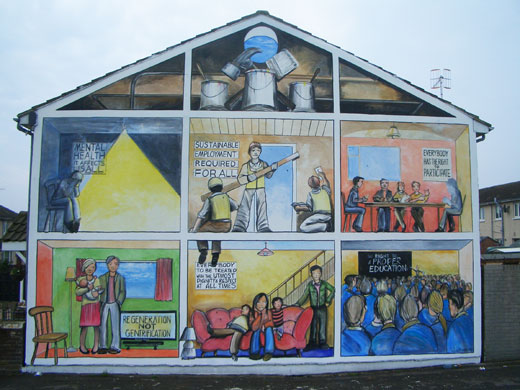
Enter the Arts Council, they have now provided £3.5 million in funding for what has now become a collection of 123 new murals. The project has been community based from the start, and is designed to make it accessible to all backgrounds and groups within Belfast. There are a number of organisations involved, including the DFSD, NI Housing Executive, The Police and the Arts Council. The grants have been awarded to projects proposed that address the issue of community relations in some way, encourage cross-community or multiracial interactions and this has led to a number of new relationships being formed. 63% of the projects have been community managed, and have involved 6,893, with a further possible 2000 artists, consultants and volunteers.
The Executive summary of the review of the work can be found in the summary through this link
Here are some other examples taken from the review of the project in the Guardian

Before: a common paramilitary image of two silhouetted gunmen commemorates the Scottish Brigade of the loyalist UDA force
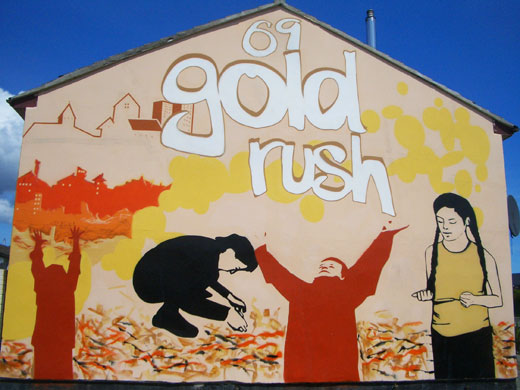
After: the new image by Tim McCarthy represents an event in July 1969 in Christopher Street when children digging in the rubble of the then demolished ‘Scotch Flats’ discovered a hoard of gold sovereigns


This is an excellent example of the new message that communities are trying to spread to the current generation, peace and co-operation over fear and segregation.
The murals are also now a major tourist attraction in Belfast, see this website for a link to tours of the walls and some examples of the murals. This companies website has lots of photos of murals and outlines the arguments for not getting rid of them.
And finally a show uploaded to YouTube discussing the differing views on marching season and a tour of the walls
Part 1
We will watch part of this show in class next week if we have time, it is worth noting that this was part of a series called "Walls of Shame" and Belfast is by no means the only divided city. Check out some of the other episodes to look for parallels we can draw and other solutions. Remember there is no right or wrong answer, its all about justification!
We have now come up with two mediums to unite communities, the sports and the arts hold great power by making a public symbol of unity, as do organisations like NICIE. You need some suggestions for solutions, this would be a good start!
Happy reading and only 10 days left to go!
Millie
Wednesday, 19 January 2011
Environmental Quality Assessments
Dear All
Today and yesterday the focus of my lessons has been the fieldwork options for the 4B paper, both of my A2 classes have been working on the same question, which was focused on primary data collection options. Although I did photograph the board with my iphone, and i have uploaded it (see below) to my blog, and the link will be on the Facebook page (I am always suprised by where IT has taken education since I left college - and thank you so much to the student who pointed out today I was probably educated with a chalk board), the photo actually wasn't that clear, and it appears some of you are overly reliant on IT as opposed to making notes for yourselves!

In short, the key points for a question on fieldwork were as follows:
1) Justify and explain your choice for data collection - we don't have the time to organize time off from college, staffing and to research a trip for this paper, the information is only released on the 1st of November and it takes time to sort out a trip for an entire year group. Also, we are dealing with a sensitive issue, and questionnaires need careful wording and experience of using them to be effective, sending them out without incentive for return will not yield results, and sending out poorly worded or potentially offensive questionnaires would not reflect well on any school or college they are linked to.
2) The Environmental Quality Assessment (EQA - not use of full name first, then subsequent use of abbreviation for the rest of the article/answer). Why have we chosen this method? Mostly because with the advent of advanced forms of Geographical Information Systems (GIS) that are also free - ie Google Earth - and provide us with up to date, high resolution images from the air, and in some cases a three dimensional image from ground level if Google Streetview is available. The EQA works by the user forming a set of criteria by which to assess quality, this needs to be defined clearly, You form five usable criteria, such as the quality of green spaces within the area, and having been in the lesson with the Ipad this week, you have all seen what kind of data we can get from Google earth. Some of the best suggestions from the two classes were the quality of the roads, the quality of green spaces, quality of housing and gardens. This is not necessarily enough to secure full marks, remember, all the marks come for JUSTIFICATION AND EXPLANATION - there are very few absolute right and wrongs in this paper, reasonable suggestions are all creditworthy as long as there is a suitable explanation! The very best answers include a sentence such as "for example, in order for green spaces to receive the highest score of 1, it should demonstrate a clear purpose, be accessible to the local population and clearly be well maintained, whereas a score of 5 would be awarded for areas that are unkempt, potentially dangerous with rubble or partially destroyed buildings and serve no clear purpose".
By doing this, you are demonstrating to the examiner that you actually know how to do an EQA! You know what is reasonable in order of gaining primary data from a secondary source such as Google Earth, and perhaps you have been prepared enough to try doing it!
3) Now you know what you are doing, how are you going to decide where to do it! Systematic, Pragmatic, Stratified or a Random sampling methodology? (Does anyone else always think of the song in the car workshop from Grease - It's systematic / It's hydromatic / Why it's grease lightning!) Again, there is no right or wrong, just a justification of which you think and an awareness of its limitations (see "What I learned in Geography This week" blog via Richuish Geography). You can link them together, ie perhaps a grid lain over the wards to be sampled on a scale of 500m between grid lines, and the the central point can be assessed, or the nearest point to that for which streetview, or a photograph on Google Earth would be available, a Pragmatically Systematic sampling methodology. Any answer is valid, just explain why!
4) You finally need to demonstrate that you have not just learnt a good answer and read a textbook, but that you can think for yourselves and have a good idea on presentation, you have your skills booklet from last year, you could graph the results, map them and draw Isolines, draw proportional symbols on the map, divide into grids and shade in (a chloropleth for those of you who remember!).
Do remember, you don't have to do one point on the map, but could assess a small area,
The example EQA from the wednesday afternoon class was useful, I have retyped it below:
Green Space (Houses)
1 = Front and/or back gardens, well kept, no rubbish/rubble and well maintained borders
5 = Evidence of damage, rubbish/rubble clearly evident around the houses, lack of gardens
Community Green Space
1 = Purposeful, well used, well manicured, close proximity/easy access for population
5 = Unkempt, evidence of fly tipping, damaged structures, poor quality scrub vegetation
Roads
1 = Good Surface, clearly marked, no plants growing in the roads
5 = Potholes, unmarked edges and central lines, overgrown roads and pavements
Quality of Housing
1 = Solid, well maintained roof and intact windows on all buildings, garages and/pr parking clearly available
5 = Collapsed or damaged roofs, evidence of vandalism/damage, empty properties
This is not meant as something for you all to learn, and i certainly would not expect you to repeat all of it in an exam, but it provides a useful template for developing your own ideas and EQA.
Once again, your language needs to be geographical, for those of you that struggle, forgive the poor language (and appalling spelling - sorry the Ipad is pretty but it doesn't automatically spell check!), but you need to "geographerise" you answer, think what you want to write, then think what words you have learned that are of relevance to the answer and try to work them in.
Hope this helps, tomorrows post will include my finalized list of essential words you need to work into your answers.

As discussed with some of you, and mentioned in my blog on Tuesday, my geography film of the week was "the age of stupid", partly chosen as we will soon be starting our final (sob/eek!) module - climate - and partly as Pete Postlethwaite, one of my favourite actors, passed away recently.
The movie is an alternative to "An Inconvenient Truth", which I know most of you have seen at school (if not, its in the library - check it out), but it is a very factual movie, and does of course have a political slant to it (surprising that). "The Age of Stupid" is set int he future, 2055, and is one man (Postlethwaite) taking a retrospective slant on why we were so blind to the signs of environmental change (note the new terminology - global warming is too confusing - go figure) that are happening with ever increasing frequency. Postlethwaite has access to all archive footage from news channels (all real) that portray the worst climatic events of our time, and the increasingly regular occurrence of extreme weather events. He reviews the NIMBY's who "care" about climate change but dont want a wind farm in their village, the oil industry worker who lost everything in Katrina and the family "doing their bit" in the countryside. Was it enough? No. Postlethwaite's world is post-apocalyptic, we are flooded out, starved, out of resources and out of time to find new ones.
I enjoyed the movie, it didnt break any new ground in terms of the science, and is by no means a replacement to learning the theory, but as an introduction to the issues and to give an excellent view of "different perspectives on the issue" (something our exam board are exceptionally keen on - take note), it cant be faulted. Why are we so reluctant? Because we like our lifestyle, other countries want our lifestyle (Westernisation/Americanisation of culture), the only way to get it, is to use fossil fuels. They took millions of years to form, their formation changed our climate into the nice low carbon one we know today, and yet we burn through this resource like we can make more of it when we want to. Wake up folks, we cant! But that's a discussion for another module!
Overall, well worth the 90 minutes it lasts for, I doubt that we will have time to watch it in class, but there is certainly enough time for you all to check it out of the library for a night or watch it in a free period in the library - that is of course after I remember to return it tomorrow!
See you all in class!
Today and yesterday the focus of my lessons has been the fieldwork options for the 4B paper, both of my A2 classes have been working on the same question, which was focused on primary data collection options. Although I did photograph the board with my iphone, and i have uploaded it (see below) to my blog, and the link will be on the Facebook page (I am always suprised by where IT has taken education since I left college - and thank you so much to the student who pointed out today I was probably educated with a chalk board), the photo actually wasn't that clear, and it appears some of you are overly reliant on IT as opposed to making notes for yourselves!

In short, the key points for a question on fieldwork were as follows:
1) Justify and explain your choice for data collection - we don't have the time to organize time off from college, staffing and to research a trip for this paper, the information is only released on the 1st of November and it takes time to sort out a trip for an entire year group. Also, we are dealing with a sensitive issue, and questionnaires need careful wording and experience of using them to be effective, sending them out without incentive for return will not yield results, and sending out poorly worded or potentially offensive questionnaires would not reflect well on any school or college they are linked to.
2) The Environmental Quality Assessment (EQA - not use of full name first, then subsequent use of abbreviation for the rest of the article/answer). Why have we chosen this method? Mostly because with the advent of advanced forms of Geographical Information Systems (GIS) that are also free - ie Google Earth - and provide us with up to date, high resolution images from the air, and in some cases a three dimensional image from ground level if Google Streetview is available. The EQA works by the user forming a set of criteria by which to assess quality, this needs to be defined clearly, You form five usable criteria, such as the quality of green spaces within the area, and having been in the lesson with the Ipad this week, you have all seen what kind of data we can get from Google earth. Some of the best suggestions from the two classes were the quality of the roads, the quality of green spaces, quality of housing and gardens. This is not necessarily enough to secure full marks, remember, all the marks come for JUSTIFICATION AND EXPLANATION - there are very few absolute right and wrongs in this paper, reasonable suggestions are all creditworthy as long as there is a suitable explanation! The very best answers include a sentence such as "for example, in order for green spaces to receive the highest score of 1, it should demonstrate a clear purpose, be accessible to the local population and clearly be well maintained, whereas a score of 5 would be awarded for areas that are unkempt, potentially dangerous with rubble or partially destroyed buildings and serve no clear purpose".
By doing this, you are demonstrating to the examiner that you actually know how to do an EQA! You know what is reasonable in order of gaining primary data from a secondary source such as Google Earth, and perhaps you have been prepared enough to try doing it!
3) Now you know what you are doing, how are you going to decide where to do it! Systematic, Pragmatic, Stratified or a Random sampling methodology? (Does anyone else always think of the song in the car workshop from Grease - It's systematic / It's hydromatic / Why it's grease lightning!) Again, there is no right or wrong, just a justification of which you think and an awareness of its limitations (see "What I learned in Geography This week" blog via Richuish Geography). You can link them together, ie perhaps a grid lain over the wards to be sampled on a scale of 500m between grid lines, and the the central point can be assessed, or the nearest point to that for which streetview, or a photograph on Google Earth would be available, a Pragmatically Systematic sampling methodology. Any answer is valid, just explain why!
4) You finally need to demonstrate that you have not just learnt a good answer and read a textbook, but that you can think for yourselves and have a good idea on presentation, you have your skills booklet from last year, you could graph the results, map them and draw Isolines, draw proportional symbols on the map, divide into grids and shade in (a chloropleth for those of you who remember!).
Do remember, you don't have to do one point on the map, but could assess a small area,
The example EQA from the wednesday afternoon class was useful, I have retyped it below:
Green Space (Houses)
1 = Front and/or back gardens, well kept, no rubbish/rubble and well maintained borders
5 = Evidence of damage, rubbish/rubble clearly evident around the houses, lack of gardens
Community Green Space
1 = Purposeful, well used, well manicured, close proximity/easy access for population
5 = Unkempt, evidence of fly tipping, damaged structures, poor quality scrub vegetation
Roads
1 = Good Surface, clearly marked, no plants growing in the roads
5 = Potholes, unmarked edges and central lines, overgrown roads and pavements
Quality of Housing
1 = Solid, well maintained roof and intact windows on all buildings, garages and/pr parking clearly available
5 = Collapsed or damaged roofs, evidence of vandalism/damage, empty properties
This is not meant as something for you all to learn, and i certainly would not expect you to repeat all of it in an exam, but it provides a useful template for developing your own ideas and EQA.
Once again, your language needs to be geographical, for those of you that struggle, forgive the poor language (and appalling spelling - sorry the Ipad is pretty but it doesn't automatically spell check!), but you need to "geographerise" you answer, think what you want to write, then think what words you have learned that are of relevance to the answer and try to work them in.
Hope this helps, tomorrows post will include my finalized list of essential words you need to work into your answers.
As discussed with some of you, and mentioned in my blog on Tuesday, my geography film of the week was "the age of stupid", partly chosen as we will soon be starting our final (sob/eek!) module - climate - and partly as Pete Postlethwaite, one of my favourite actors, passed away recently.
The movie is an alternative to "An Inconvenient Truth", which I know most of you have seen at school (if not, its in the library - check it out), but it is a very factual movie, and does of course have a political slant to it (surprising that). "The Age of Stupid" is set int he future, 2055, and is one man (Postlethwaite) taking a retrospective slant on why we were so blind to the signs of environmental change (note the new terminology - global warming is too confusing - go figure) that are happening with ever increasing frequency. Postlethwaite has access to all archive footage from news channels (all real) that portray the worst climatic events of our time, and the increasingly regular occurrence of extreme weather events. He reviews the NIMBY's who "care" about climate change but dont want a wind farm in their village, the oil industry worker who lost everything in Katrina and the family "doing their bit" in the countryside. Was it enough? No. Postlethwaite's world is post-apocalyptic, we are flooded out, starved, out of resources and out of time to find new ones.
I enjoyed the movie, it didnt break any new ground in terms of the science, and is by no means a replacement to learning the theory, but as an introduction to the issues and to give an excellent view of "different perspectives on the issue" (something our exam board are exceptionally keen on - take note), it cant be faulted. Why are we so reluctant? Because we like our lifestyle, other countries want our lifestyle (Westernisation/Americanisation of culture), the only way to get it, is to use fossil fuels. They took millions of years to form, their formation changed our climate into the nice low carbon one we know today, and yet we burn through this resource like we can make more of it when we want to. Wake up folks, we cant! But that's a discussion for another module!
Overall, well worth the 90 minutes it lasts for, I doubt that we will have time to watch it in class, but there is certainly enough time for you all to check it out of the library for a night or watch it in a free period in the library - that is of course after I remember to return it tomorrow!
See you all in class!
Sunday, 16 January 2011
Welcome to my Geography Teaching Blog!
Hello!
This is the first of what will hopefully be a read-worthy blog for the rest of the academic year, it is linked to my Facebook Page - Richuish Geography, and for those of you who havent sussed it yet (hopefully that doesnt apply to my students) I am a Geography teacher!
This blog will be filled with updates on what I hope i have achieved in me A-Level classroom this week, and interesting things I read and think about geography and geology as and when I read or think them! This week, is the final week of the Skills exam for my lower sixth, and the Belfast unit for my upper sixth, who have had their pre-release material since november, and only have to immerse themselves in Belfasts history and development for another two weeks! I feel sure many of them are counting down the days - if thats you, attend the event on the facebook page and share your feelings about Belfast, and preferably any exciting links or resources you have found
 This weekend, what has mostly been fascinating me is the new eruption at Mt Etna (see above), I do love my Sicilian volcanoes, and Etna is one of my favourites, i have been many times, three of them with college (we have an unfortunate/fortunate habit of stopping volcanic eruptions by just arriving in the country!), and this weeks NASA Earth Observatory Photo was just stunning (Takes a while to load - http://earthobservatory.nasa.gov/images/imagerecords/48000/48612/etna_tmo_2011011_lrg.jpg) The video foottage showed some fabulous fire fountains, and once again the Sicilians show they are well on track with volcano management, close the airports, divert the flights and then clean up!
Lovely stuff, almost as good as the footage from Vanuatu last year, but I'll save that for another blog. Also on my reading list this week, the horrendous flooding in Brazil, Australia and Sri Lanka. The La Nina effect is in full force this year, shame it is not on the syllabus, but unfortunately we no longer cover El Nino/La Nina oscillations.
Lastly, is a small whinge on my part, if i hear one more person tell me that it was so cold this winter global warming clearly is happening I will start a public service of street lectures on why they are so wrong! Students, climate is our next module, and we do have a lesson called "skeptic bashing" which is a game where you score points for effectively countering common misinterpretations on global climate change - get your best response to that one prepared!
This is the first of what will hopefully be a read-worthy blog for the rest of the academic year, it is linked to my Facebook Page - Richuish Geography, and for those of you who havent sussed it yet (hopefully that doesnt apply to my students) I am a Geography teacher!
This blog will be filled with updates on what I hope i have achieved in me A-Level classroom this week, and interesting things I read and think about geography and geology as and when I read or think them! This week, is the final week of the Skills exam for my lower sixth, and the Belfast unit for my upper sixth, who have had their pre-release material since november, and only have to immerse themselves in Belfasts history and development for another two weeks! I feel sure many of them are counting down the days - if thats you, attend the event on the facebook page and share your feelings about Belfast, and preferably any exciting links or resources you have found

Lovely stuff, almost as good as the footage from Vanuatu last year, but I'll save that for another blog. Also on my reading list this week, the horrendous flooding in Brazil, Australia and Sri Lanka. The La Nina effect is in full force this year, shame it is not on the syllabus, but unfortunately we no longer cover El Nino/La Nina oscillations.
Lastly, is a small whinge on my part, if i hear one more person tell me that it was so cold this winter global warming clearly is happening I will start a public service of street lectures on why they are so wrong! Students, climate is our next module, and we do have a lesson called "skeptic bashing" which is a game where you score points for effectively countering common misinterpretations on global climate change - get your best response to that one prepared!
Subscribe to:
Posts (Atom)